Visual Explainer: Mapping Complex Codebases with Claude Code
The Challenge of Code Discovery
Every developer knows the sinking feeling of inheriting a legacy codebase without documentation. You spend hours tracing execution flows through Laravel controllers and Filament resources just to understand basic data shapes. Nico Bailon recently addressed this friction by releasing Visual Explainer, a specialized skill for Claude Code. This tool transforms static text analysis into interactive HTML dashboards, providing a birds-eye view of project architecture that was previously locked behind hours of manual investigation.
Under the Hood: The Prompt Engine
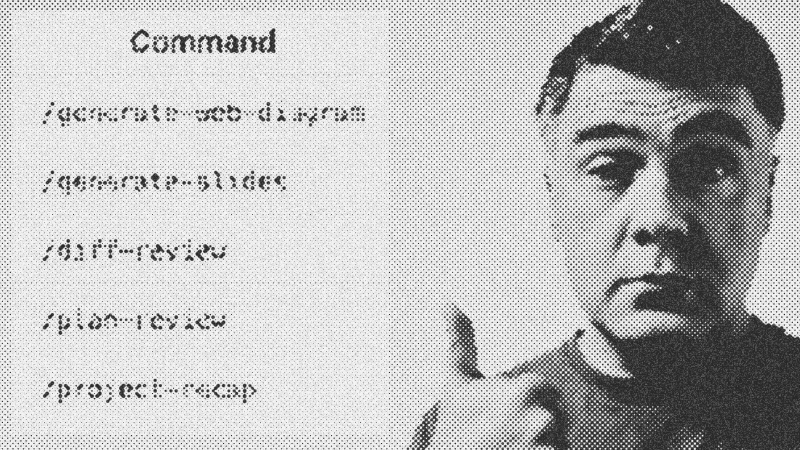
The magic isn't just in the visualization; it resides in the sophisticated prompts. The tool uses a hierarchical structure where the overarching Visual Explainer prompt coordinates sub-prompts for project identity, git history slicing, and Mermaid diagram generation. It even supports an ultra-think mode for deep reasoning. While this intensive analysis can consume significant tokens, my testing showed a manageable jump from 18% to 21% of a standard session limit for a full project recap. The output includes everything from authentication flows to role-based access matrices, presenting data that is far easier to parse than a wall of Markdown text.
Strategic Use Cases and Performance
I found that narrowing the scope yields the best results. A generic project recap can feel verbose, but asking for a specific web diagram of user roles produces a focused, actionable visual. This makes it an excellent companion for planning phases. Instead of debating a feature's impact in the dark, you can generate a visual plan to validate logic before writing a single line of code. It mirrors the interactive nature of Claude Playgrounds, but with a sharper focus on architectural clarity and project state.
Final Verdict
Visual Explainer is a high-utility addition to any AI-assisted workflow. It bridges the gap between raw code analysis and human comprehension. While the token cost is a factor for massive repositories, the time saved during onboarding or complex refactoring makes it a must-have skill for serious developers.
- Visual Explainer
- 25%· software
- AI
- 8%· software
- Claude Code
- 8%· software
- Claude Playgrounds
- 8%· software
- Filament
- 8%· software
- Other topics
- 42%
NEW Visual Explainer Skill: HTML Plans/Summaries (Claude Code Example)
WatchAI Coding Daily // 7:02

This channel is not for vibe-coders. It's for professional devs who want to use AI as powerful assistant, while still keeping the control of their codebase. My name is Povilas Korop, and I'm passionate about coding with AI. So I started this THIRD YouTube channel, in addition to my other ones Laravel Daily and Filament Daily. You will see a lot of my experiments with AI: I will try new things and share my discoveries along the way.